View
Dashboard View opens the Dataset — the list of everything in your project (patients, studies, and series). From Dataset you open study projections or a full Series View to review pixels and run Process tools.
(Earlier versions called Dataset the PHI Index.)
Goal
See what you imported, check AI status columns, open projections for a study, open a series for review or Process tools, and export a Patient Lookup CSV when needed.
Demo studies
After importing from tests/controller/assets/test_dcm_files (see Search), Dataset should list these three studies (help shots do not use synthetic phantoms):
| Fixture | Role in the manual |
|---|---|
davidson_cxr |
Open in Series View here; burned-in text in Remove Pixel PHI |
CT_Head_With_Contrast |
Harmonize and Face blur |
us_rgb_single_frame |
Ultrasound single-frame; burned-in overlays in Remove Pixel PHI (exclude-area demos) |
Open Dataset
- From the Dashboard, click View.
- Expand a study row (triangle) to see nested series.
- Note PHI / anonymized IDs and the AI status columns.
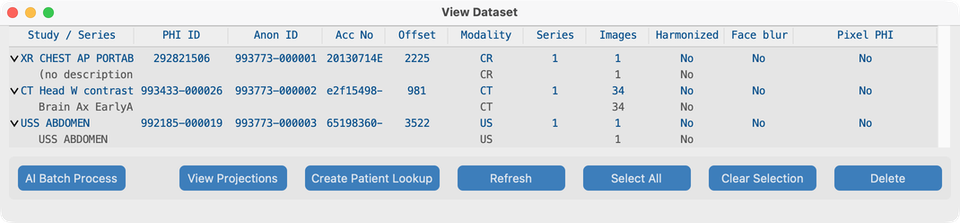
Columns (V19)
| Status | Meaning |
|---|---|
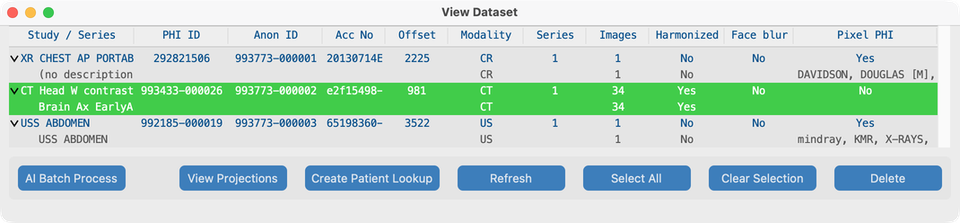
| Harmonized | Series description standardized (or study-level description applied) |
| Face blur | Face de-identification applied |
| Pixel PHI | Burned-in text scan / removal recorded |
Right-click in Dataset (most important)
Hover tips on the tree say what a right-click will do. Selection follows the row under the pointer.
Left-click the study or series description (first column) when a single row is selected — see Edit study and series descriptions below. Use Shift or Cmd/Ctrl+Click to multi-select; then right-click the selection to set one description on all selected rows.
Right-click a study → View Projections
Right-click a study row (not a nested series) to open Projection View for that study.
- You see summary projection images for each series in the study (useful to scan a multi-series exam quickly).
- Click a projection tile when you want to jump into full Series View for that series.

Multiple studies → View Projections
To browse several exams at once:
- In Dataset, select two or more study rows (Shift+Click and/or Cmd/Ctrl+Click), or use Select All.
- Click View Projections in the Dataset toolbar.
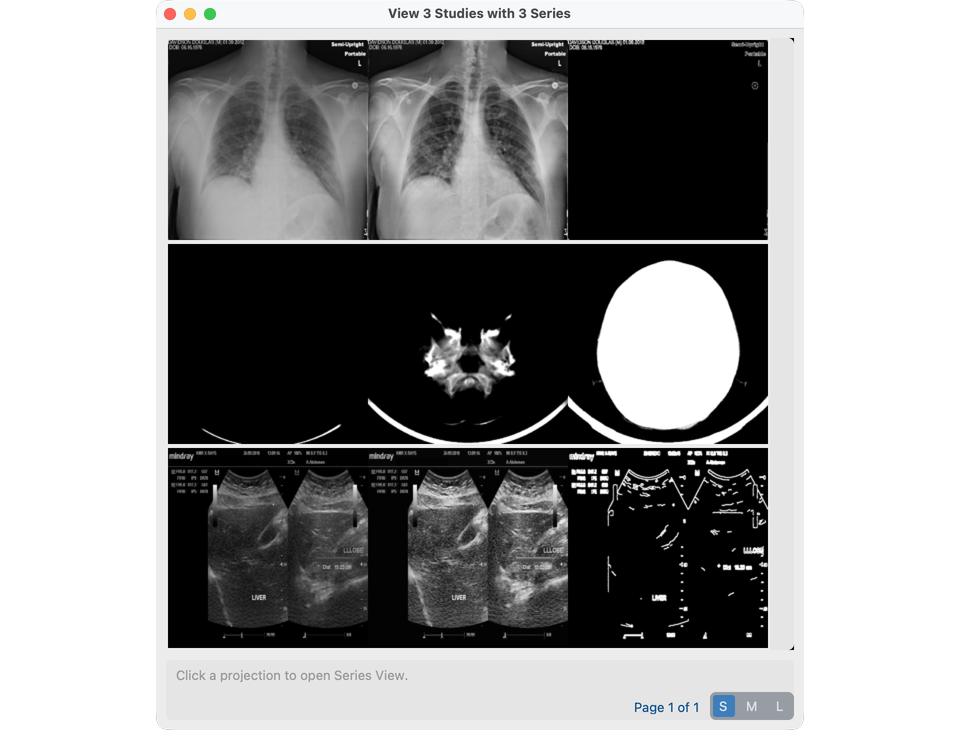
The window title becomes View N Studies with M Series (and over P Pages when the grid needs paging). Each series still gets one projection tile.
Projection tiles, S / M / L, and how they are built
Each tile is a strip of three preview images for one series:
| Series type | Left | Center | Right |
|---|---|---|---|
| Multi-frame (e.g. CT stack) | Min intensity across frames | Mean | Max |
| Single-frame (e.g. CXR, many US) | Grayscale | CLAHE contrast | Edge (Canny) |
The S / M / L control sets how large each of those three panels is drawn (before display scaling):
| Size | Tile panel size | Typical use |
|---|---|---|
| S | 200×200 | Fit many series on one page |
| M | 400×400 | Default help / review size |
| L | 800×800 | Inspect anatomy in the strip |
Changing size recalculates how many tiles fit per page and may add a page slider. Click any tile to open that series in Series View.
What happens when a projection is created
- The app looks for a cached
Projection.pklnext to the series files. - On a cache hit, it loads that object and draws the three images (resized to S/M/L).
- On a miss, it loads every frame in the series, computes the three images above (windowed for multi-frame), writes
Projection.pkl, then draws the tile. - Pixel edits that change the series on disk invalidate the cache so the next open rebuilds from current pixels.
This Dataset View Projections window is separate from the slice / min / mean / max modes inside Series View.
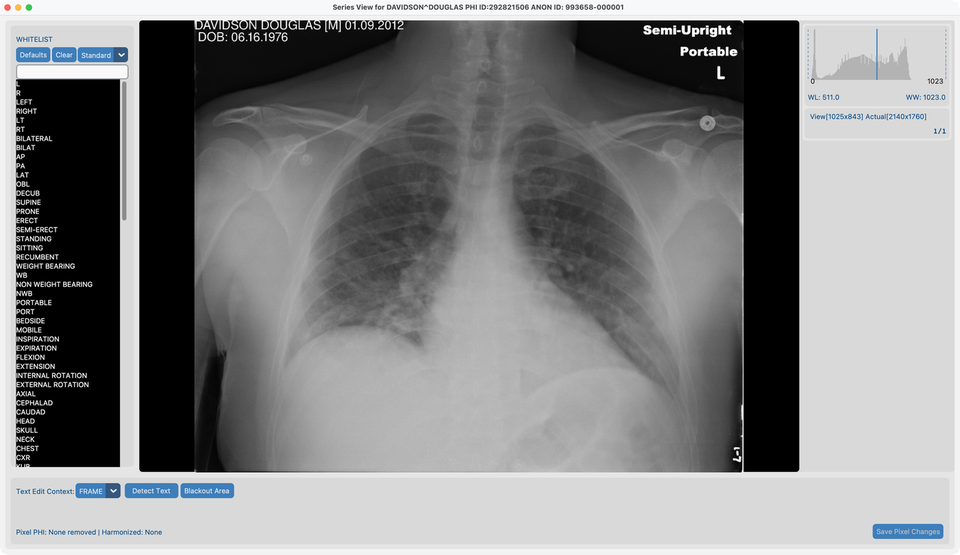
Right-click a series → Series View
- Expand the study that contains the series (for example
davidson_cxr). - Right-click the series row (not the study row).
- Series View opens and loads the images.
That is the main way to open a series for review and for Process tools (Remove Pixel PHI, Harmonize, Face blur).
Edit study and series descriptions
After Harmonize (Series View or AI Batch), green Harmonized rows show the standardized name. You can also set RadLex / LOINC names on unharmonized rows from Dataset — choosing a standard name writes DICOM and marks the row harmonized (green after refresh).
Hover tooltips explain what a click or toolbar action will do (including why a button is disabled).
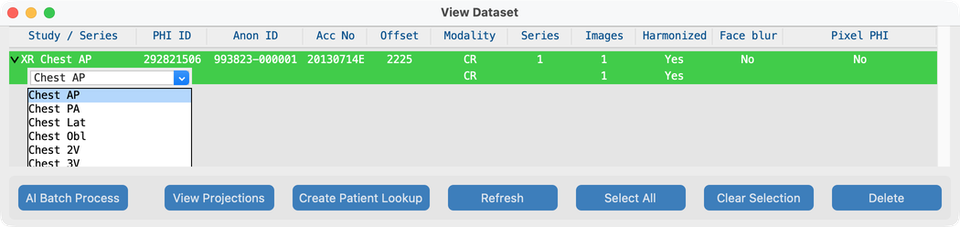
Single-click selects a row. Double-click a study or series description (harmonized or not) to open Set description. Esc or click away cancels an open inline menu. Shift+Click and Cmd/Ctrl+Click only change selection — they do not open the editor. With several series or studies selected (same modality), right-click the selection to open Set description.
Series description (RadLex)
- Expand the study and double-click the series description in the first column (one row selected).
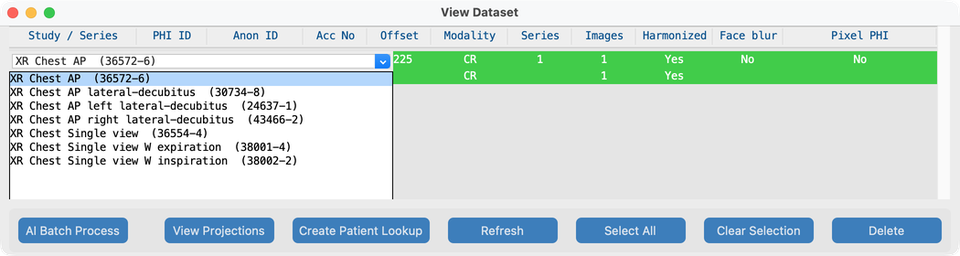
- Choose a RadLex / Playbook-style name for that modality (for example XR views: Chest AP → PA / Lat / Obl / 2V; CT/MR: plane or contrast swaps).
- The tree refreshes when you pick a value.
Study description (LOINC)
- Double-click the study description in the first column (the parent row).
- Choose a LOINC Long Common Name for that modality prefix (XR / US / MG / CT / MR). Each option is shown as
Long Common Name (LoincNumber). - The list is ranked from the study’s harmonized series names when available (and view count for CXR when known), then padded from the same modality’s LOINC catalog.
- Applying a choice updates Study Description (and Procedure Code Sequence when a LOINC number is present).
Set description (group edit)
- Select only series or only studies, all with the same modality cohort.
- Right-click any selected row and pick one RadLex (series) or LOINC (study) value.
- That exact string is applied to every selected row. Hover tips change in multi-select mode to say so.
Select Similar
With a single study or series selected, Select Similar adds other rows that already share the same series descriptions (studies) or the same series description text (series). Then right-click the selection to set one description on all selected rows.
Series View — what you can do
Series View is where you look at pixels and run per-series tools (models must be ready — see AI Features setup):
- Scroll frames; use the histogram and toolbars as needed
- Detect / remove burned-in text (OCR) and whitelist editing → Remove Pixel PHI
- Harmonize Description → Harmonize names
- Face blur (when eligible) → Blur faces
- Segmentation latch overlays from cached anatomy masks (after Harmonize)
- Manual blackout rectangles
- Clear analysis cache (does not by itself rewrite DICOM pixels)
Inside Series View, multi-frame series can also show slice / min / mean / max projection modes in the viewer (same idea as the multi-frame strip above, but for interactive scrolling).
Other Dataset actions
- Select studies for AI Batch Process or Send
- Spot-check AI status columns after Series View or batch runs
- Create Patient Lookup CSV (below)
Create Patient Lookup CSV
Use Dataset to export a spreadsheet that maps PHI identifiers to anonymized IDs (and series AI status). This is separate from the optional CTP Patient Lookup Table used at import time.
When to use it
- Hand a mapping file to the receiving site or study coordinator
- Audit which series were harmonized, face-blurred, or had pixel PHI removed
- Keep a durable copy under the project’s private storage
Steps
- Open Dataset from the Dashboard (View).
- Click Create Patient Lookup in the Dataset toolbar (no study selection required — the CSV covers the whole project index). Prefer exporting after Process so AI status columns are populated.
- On success, a dialog shows the saved path. Files are written under:
…/<project>/private/phi_export/
Filename pattern:
{site_id}_{project_name}_PHI_{patients}_{studies}_{series}.csv
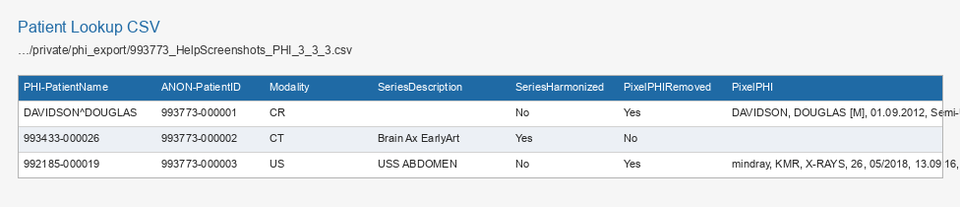
- Open the CSV in a spreadsheet. One row per series (study and patient fields are repeated on each series row). Studies with no series still emit one row with empty series columns. Help examples use davidson CXR, CT head (
CT_Head_With_Contrast), and ultrasound single-frame (not synthetic phantoms).
Columns (summary)
| Group | Examples |
|---|---|
| Anonymized IDs | ANON-PatientID, ANON-PatientName, ANON-StudyUID, ANON-SeriesUID, ANON-AccNo |
| PHI counterparts | PHI-PatientName, PHI-PatientID, PHI-StudyDate, PHI-StudyUID, PHI-AccNo |
| Study / series | DateOffset, Series, StudyInstances, Modality, SeriesDescription, Instances |
| AI status | SeriesHarmonized, FaceBlurred, PixelPHIRemoved, PixelPHI |
What good looks like
- Nested study → series tree matches what you imported (
davidson_cxr,CT_Head_With_Contrast,us_rgb_single_frame). - Right-click study opens projections; multi-select + View Projections opens all selected studies; right-click series opens Series View; multi-select + right-click opens Set description.
- Double-clicking a series or study description (single selection) opens RadLex / LOINC Set description; single-click only selects the row; modifier clicks keep multi-select.
- S / M / L changes tile size; first open may build
Projection.pklunder each series. davidson_cxrloads and scrolls in Series View.- AI columns update after Process tools.
- Create Patient Lookup writes a CSV under
private/phi_export/that opens with the expected columns.
If it fails
- Empty list → import first (Search).
- Series missing on disk → Series Not Found; re-import or check storage path.
- Tools greyed out in Series View → download models / accept license in AI Features.
- Harmonize already running → finish or cancel the other series first.
- Create Patient Lookup error → ensure the project has studies in the Dataset index and that
private/phi_export/is writable.
Next steps
Continue with Process — Remove Pixel PHI, Harmonize, Face blur, and batch. After review, Send anonymized patients.