Item 18 — Measures of inter- and intra-rater variability of features described by the annotators
Describe the methods to measure inter- and intra-rater variability, reduce or mitigate variability, and/or resolve discrepancies between annotators.
Explanation and Elaboration: Inter- and intrarater variability should be reported to assess the consistency of annotations used in training or evaluating AI models. Confusion between agreement and reliability is common. Agreement measures how closely raters match each other’s labels, while reliability reflects the ability to consistently distinguish between classes. Common measures for categorical data include Cohen’s kappa (two raters) and Fleiss’ kappa (multiple raters) (41). For continuous or ordinal data, the intraclass correlation coefficient (ICC) assesses reliability, while agreement is often shown with a Bland–Altman plot. Annotation conditions should be specified, including time intervals for repeated measures (test–retest reliability). Statistical methods used to quantify variability should be detailed, including their context (e.g., kappa > 0.8 often reflects strong agreement, though thresholds may vary) (41). Methods to mitigate variability include structured training, accounting for learning effects, and standardized protocols. Calibration sessions can align annotators on definitions before formal labeling. Blinding raters to clinical data and AI outputs can help maintain consistency. All steps taken to reduce variability should be reported. Discrepancies can be resolved through majority vote, consensus, or expert adjudication. These approaches have different strengths; rationale and potential influence on results should be reported. For subjective or complex imaging features, variability may be higher; in such cases, thresholds for agreement should be justified and supported by prior work, if available.
| Examples |
The interstudy repeatability was assessed with interclass correlation coefficient (ICC) and Bland-Altman analysis to compare the scan-rescan variation in the automated and manual cardiac MRI measurements. The paired t test was calculated to compare the differences in scan-rescan measurements between AI and manual assessment…. The interstudy repeatability of cardiac MRI measurements was high for both AI and manual measurements. The automatic LV and RV volumetric and mass measurements ICC were 0.92 and 0.99, respectively. The ICC for LV and RV ejection fraction was 0.80 and 0.90, respectively (Table 5). [Methods and results (42), CC-BY 4.0] |
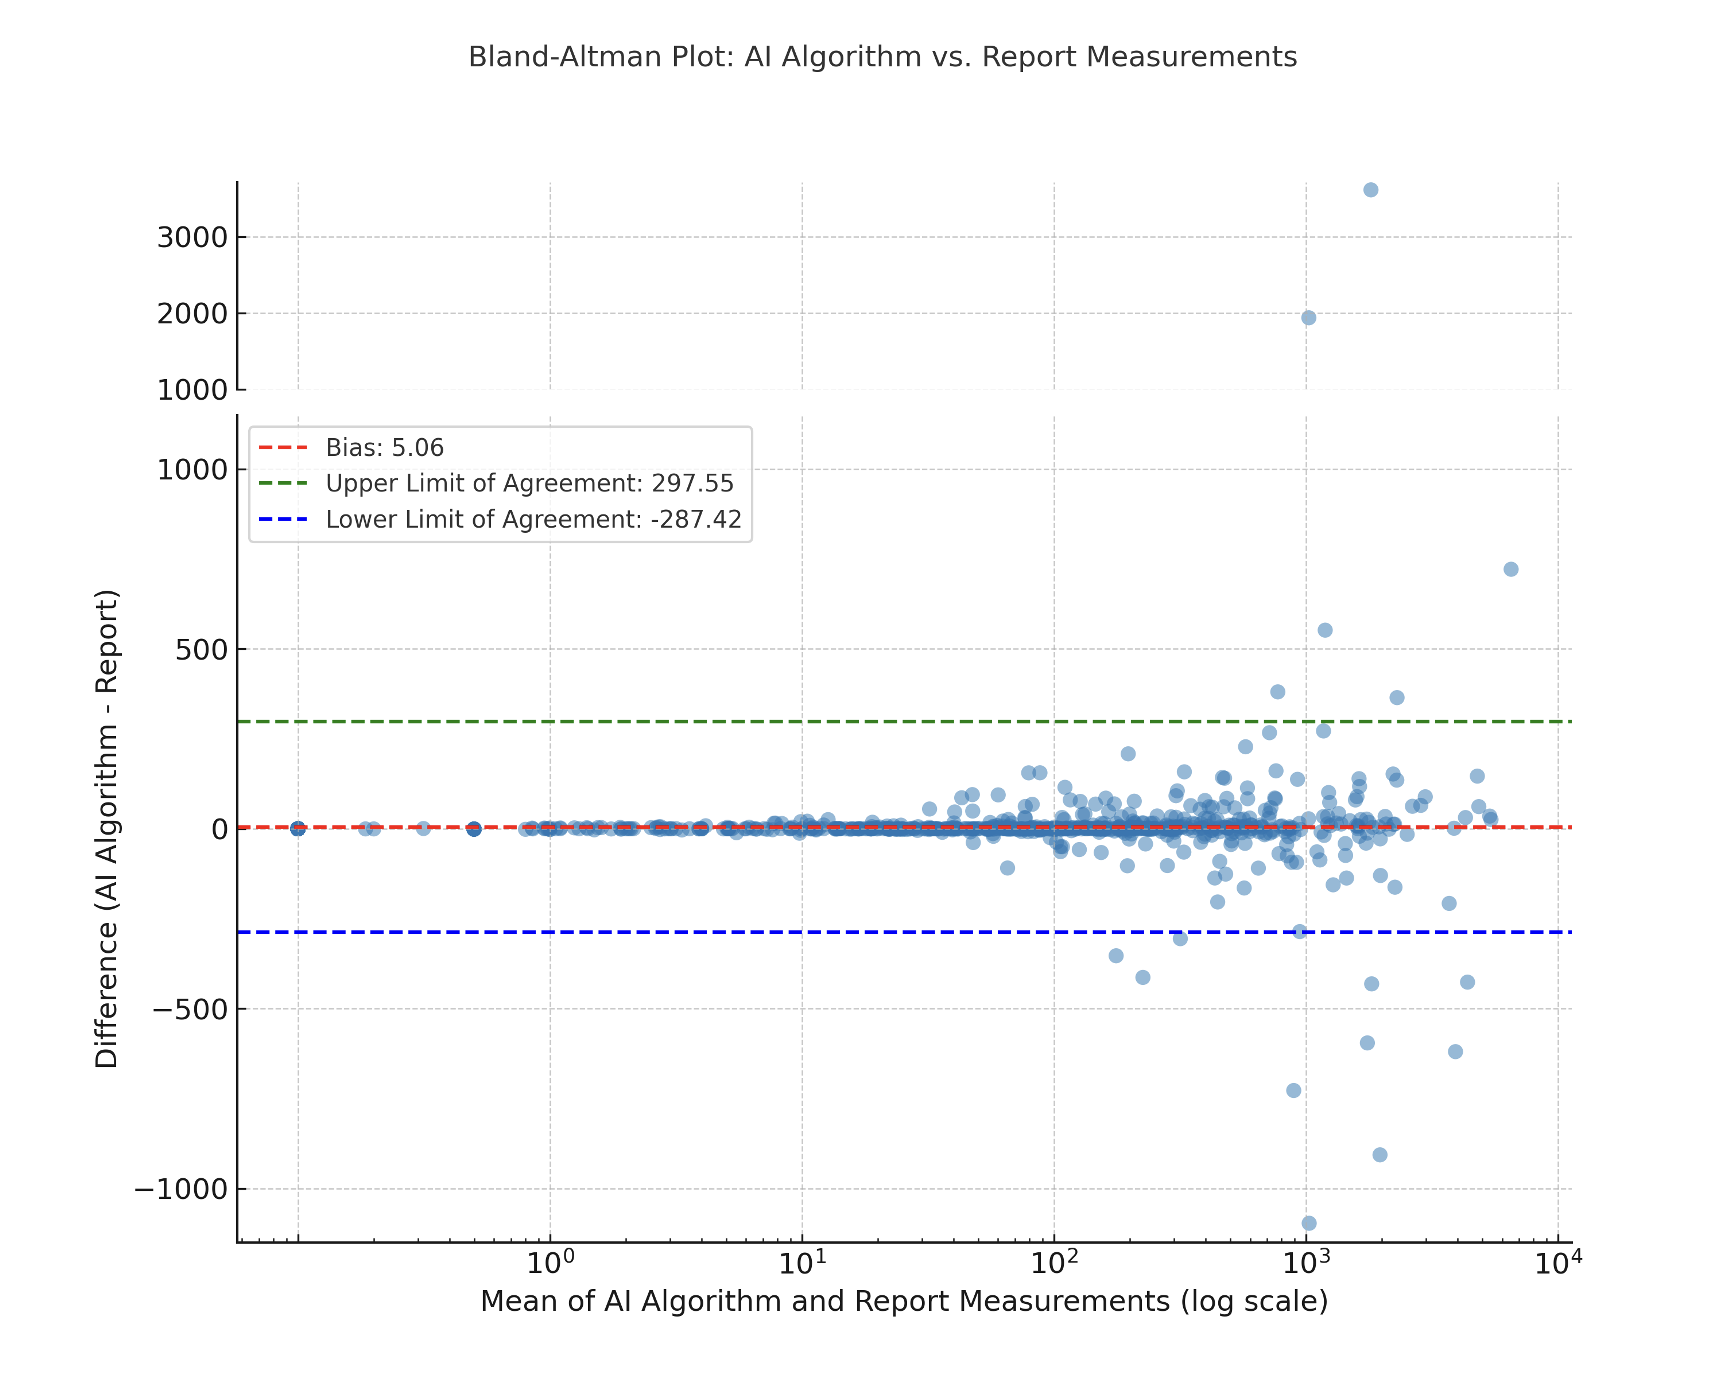
A Bland-Altman plot comparing the AI-derived and expert CACS is depicted in Figure S1, revealing a bias of 5.06 Agatston units, with 95% LOA from −287.42 to 297.55. Stratified analysis per scanner manufacturer showed a bias of 4.67 (95% LOA: −118.65 to 127.99) for Siemens Healthineers, 5.83 (95% LOA: −341.36 to 353.02) for Canon, and 3.23 (95% LOA: −348.72 to 355.19) for Philips scanners.
Figure S1: Bland-Altman plot between coronary artery calcium scoring in Agatston units obtained from original cardiac CT report and AI algorithm. [Results and Figure S1 (43), © RSNA 2025] |